
Final Thoughts
Whether you’re a data analyst, business professional, or Power BI developer, dark mode in Power BI can significantly enhance your workflow. From reducing eye strain to improving data readability and creating visually appealing dashboards, it’s a small but impactful change that can transform how you interact with data.
If you’re looking for expert insights or need help optimizing your Power BI experience, PowerBIKit offers valuable resources to enhance your data visualization strategies. Explore how dark mode and other customization techniques can help you build better dashboards and work smarter with Power BI.
1. Enhances Data Visibility and Readability
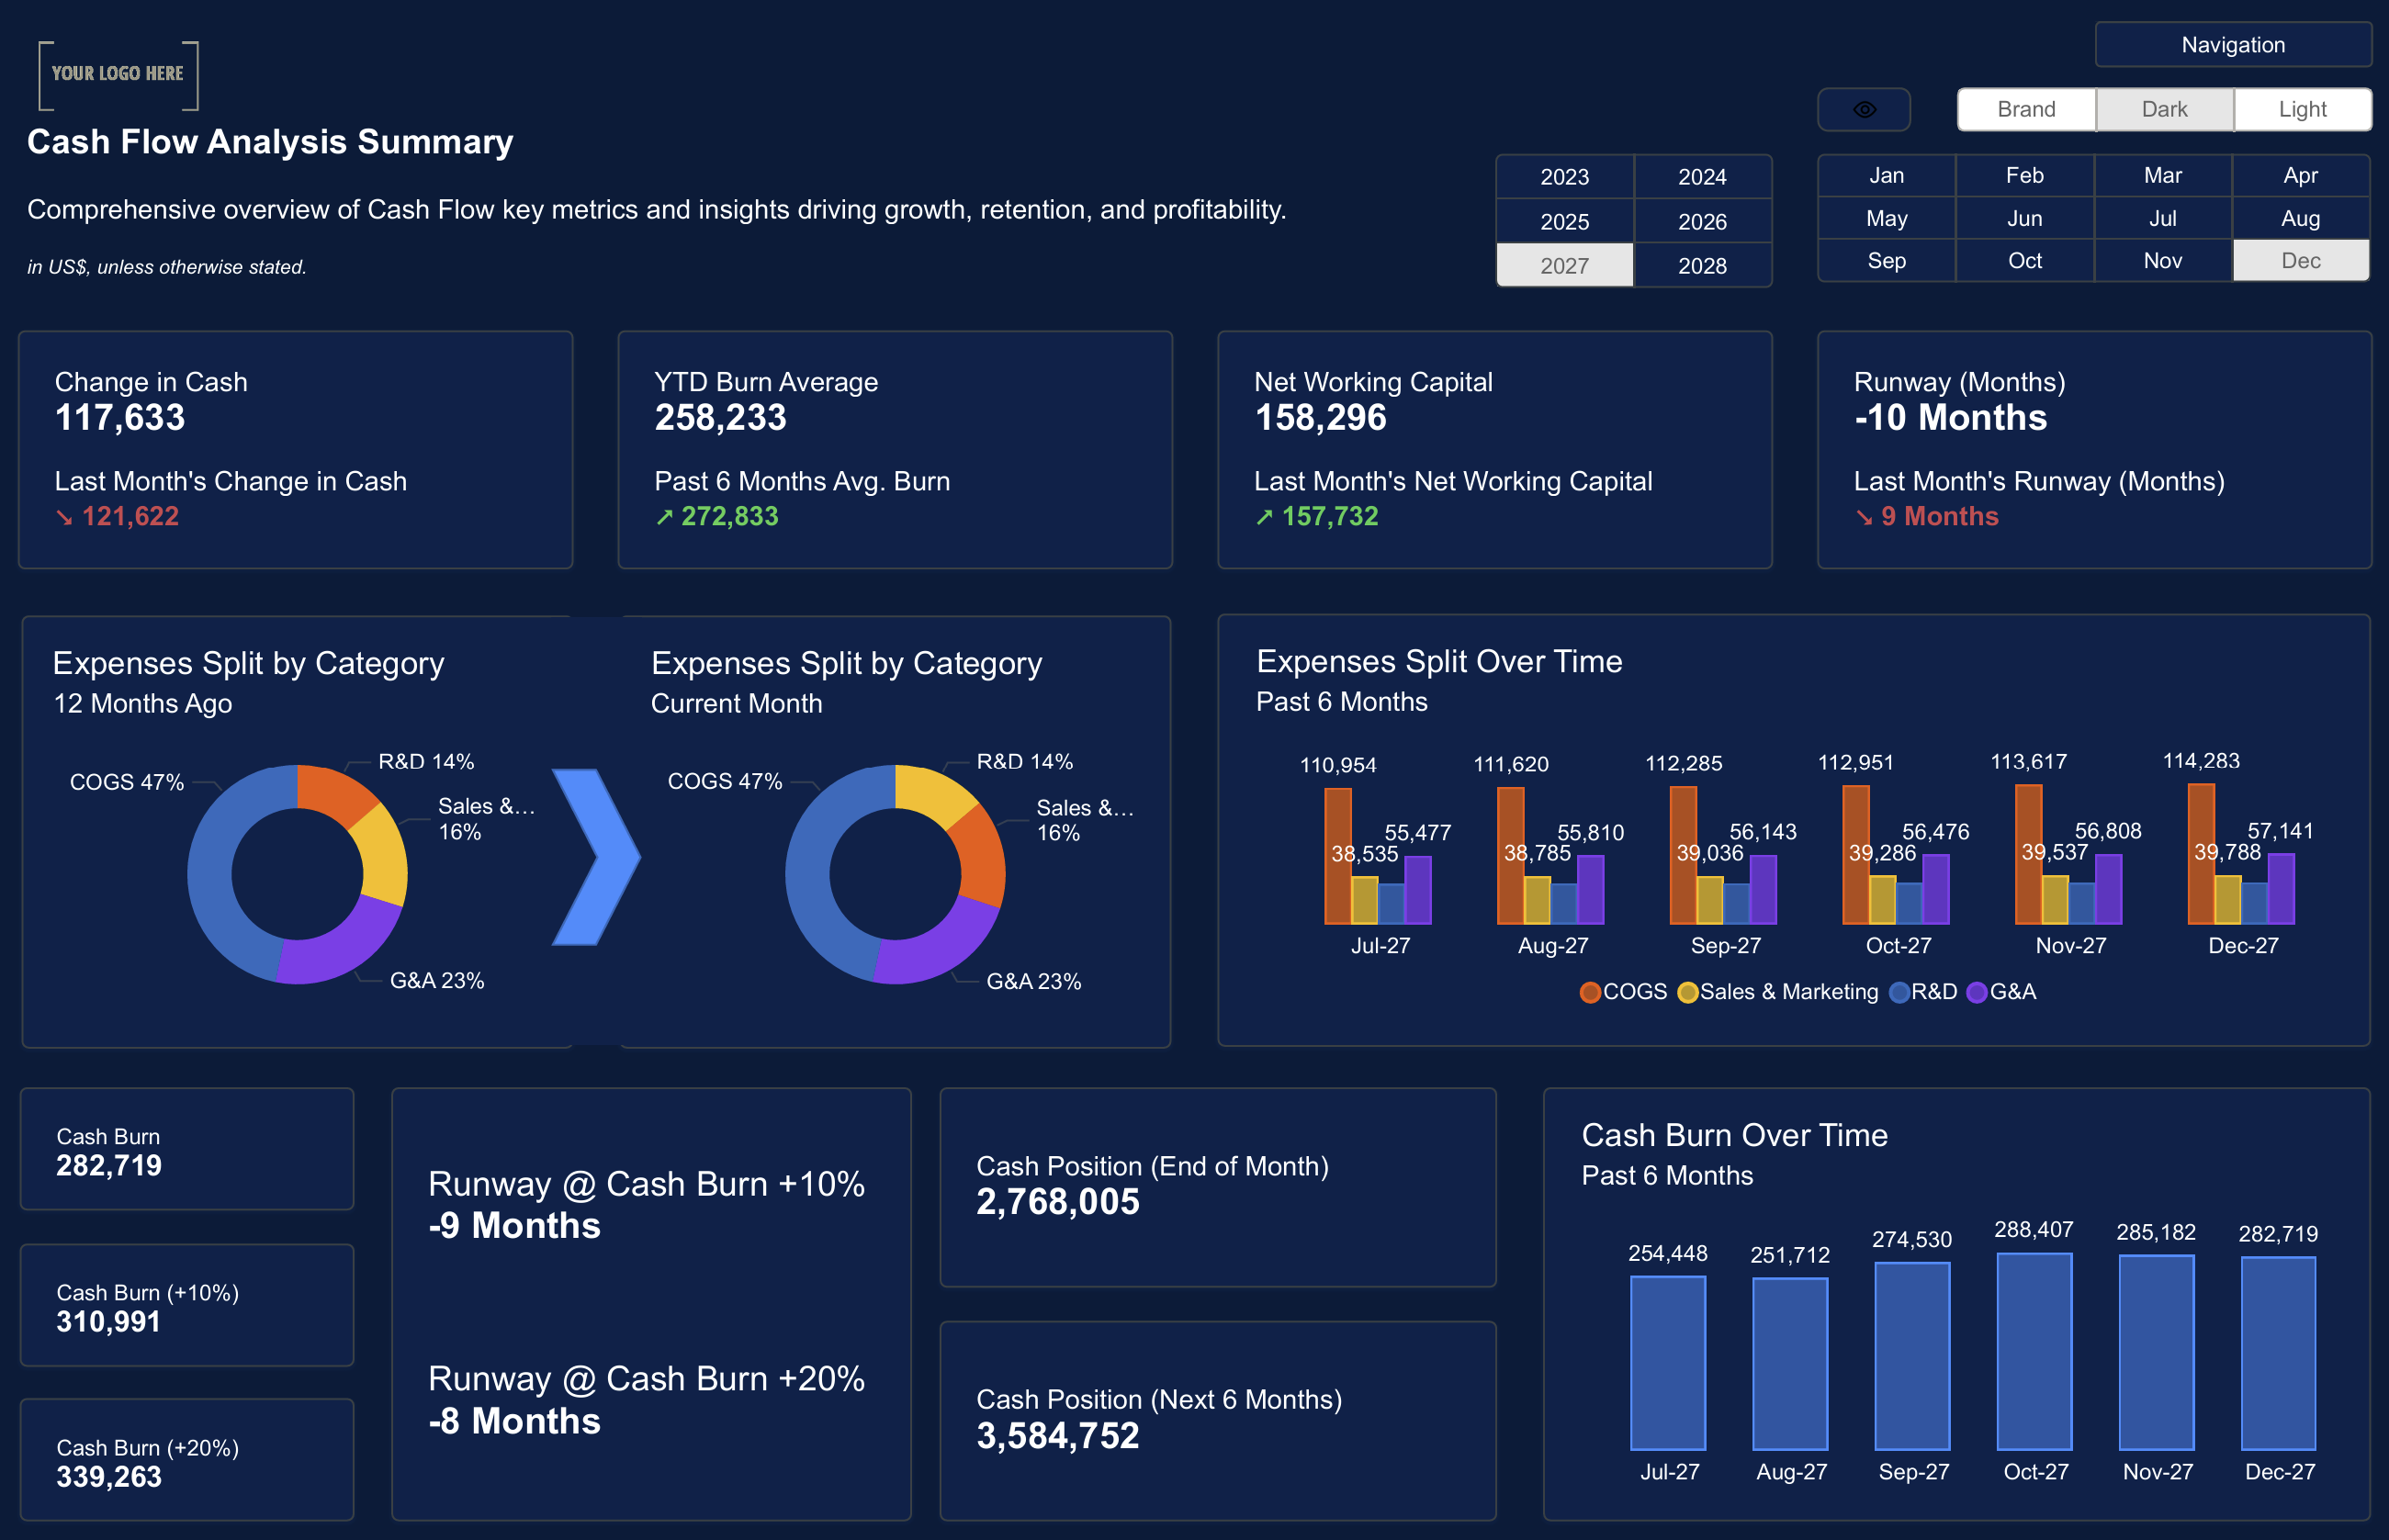
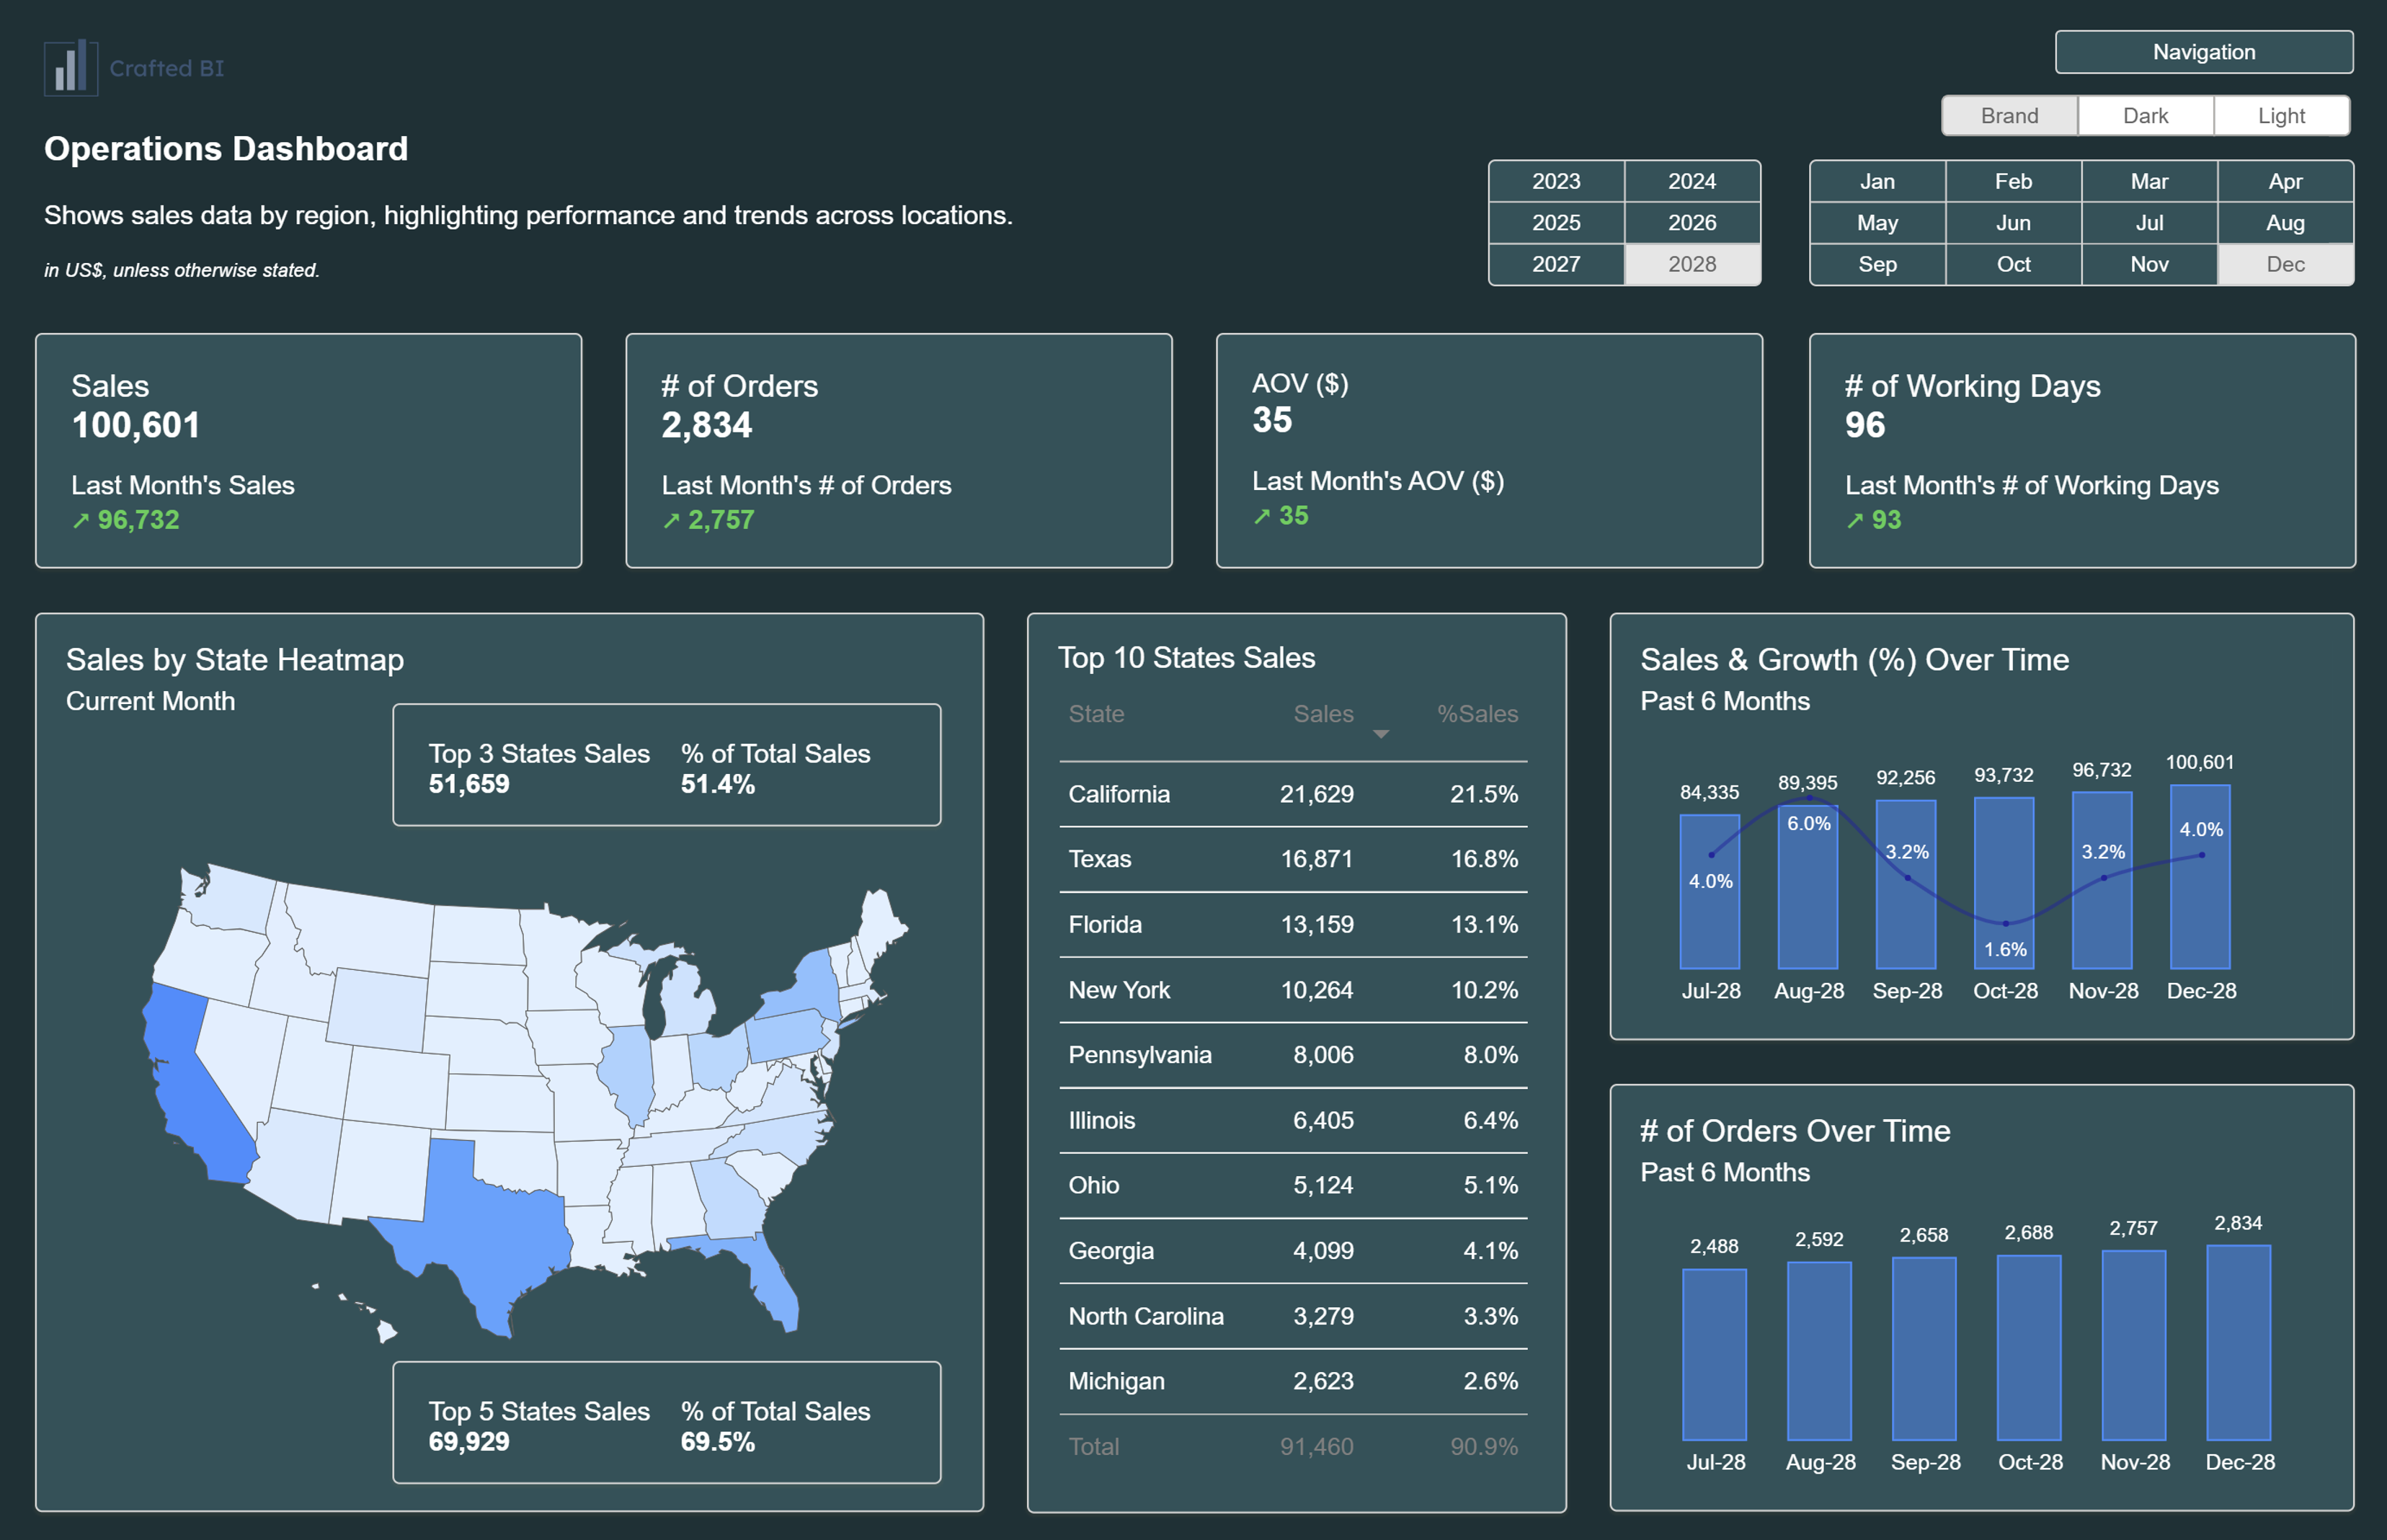
A well-designed dark-themed dashboard enhances data contrast, making it easier to identify key metrics and trends at a glance. Bright charts, graphs, and text elements stand out more against a darker background, improving overall readability.
This improved contrast helps users focus on the most critical aspects of their reports, ensuring that insights are easy to interpret without distractions. For example, a bright red or green indicator on a dark Power BI dashboard will be far more noticeable than on a traditional white background, making it easier to spot performance changes, anomalies, or key alerts.
When presenting reports to management or stakeholders, you want them to grasp the information quickly and accurately. A dark mode dashboard ensures that key metrics are clearly visible, reducing the chances of misinterpretation.
2. Gives Dashboards a Modern and Professional Look
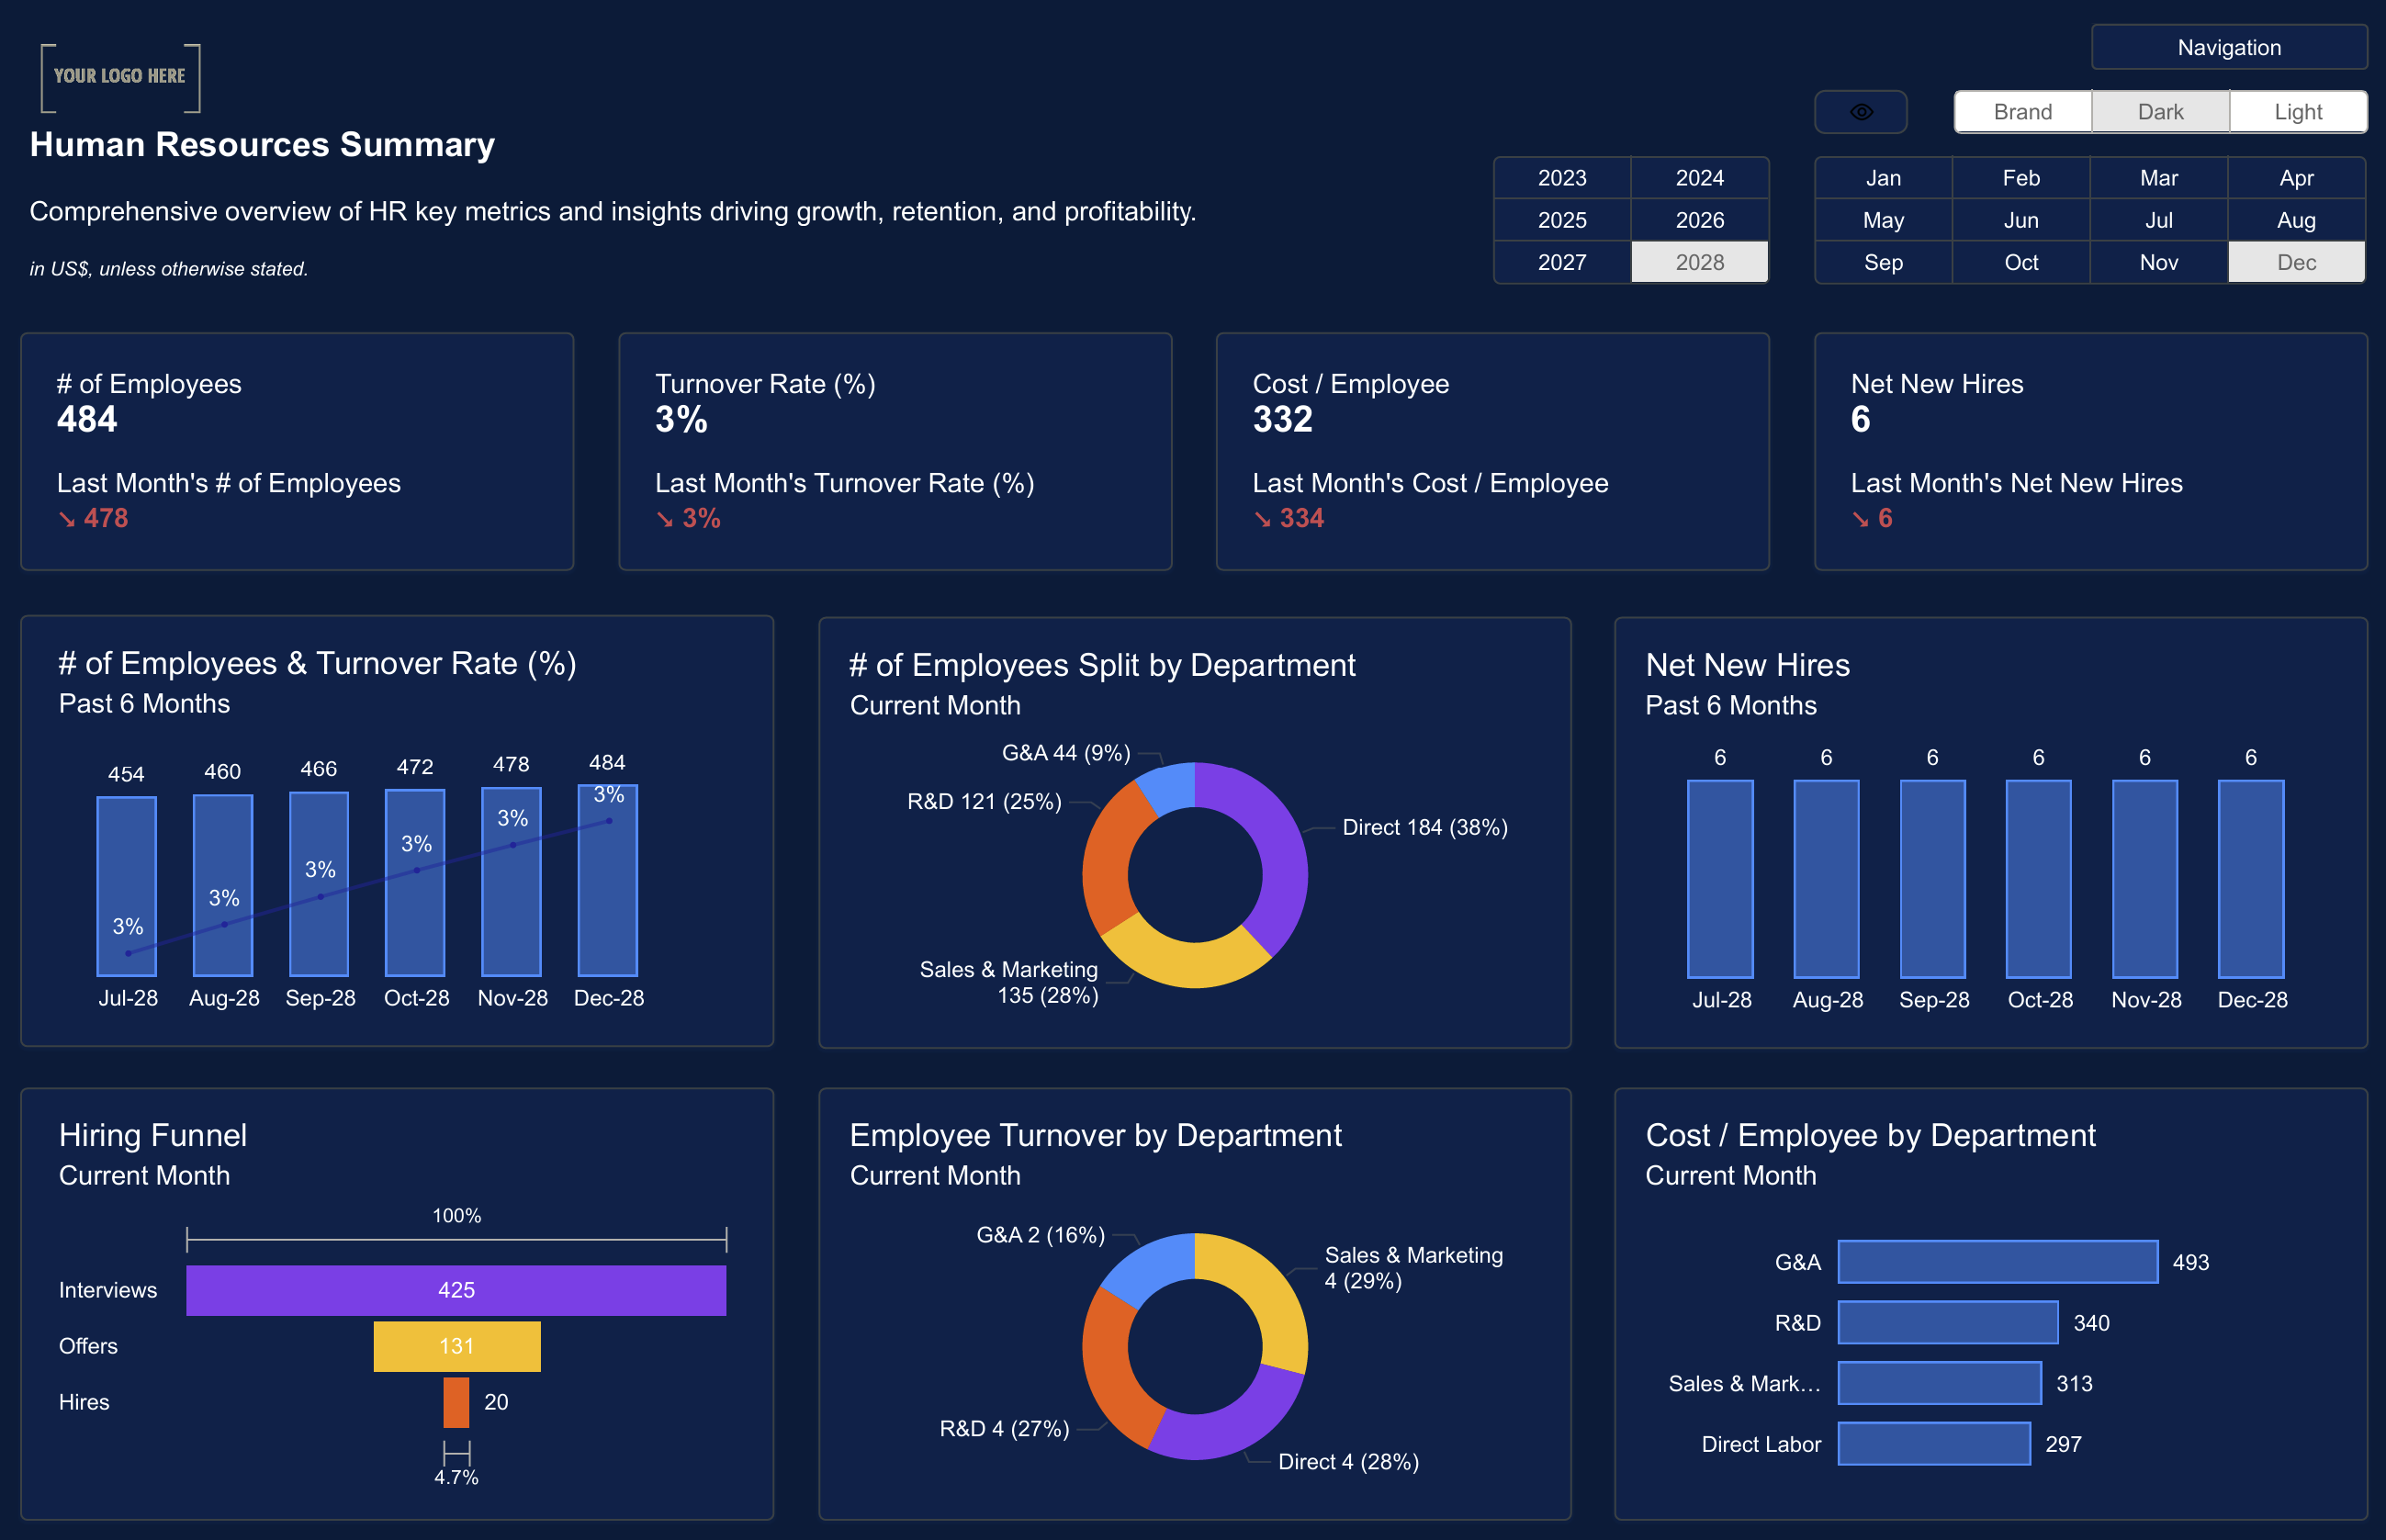
Beyond functionality, dark mode adds a sleek and polished feel to your dashboards. Many professionals prefer darker interfaces for their modern, high-tech aesthetic, making reports look more professional and engaging.
Industries like finance, cybersecurity, and IT often adopt dark themes to align with their branding and create a premium look and feel. When presenting reports to clients or stakeholders, a well-designed dark mode dashboard can leave a lasting impression and help differentiate your work from standard templates.
A visually appealing interface is more likely to keep users engaged. Dark mode in Power BI dashboards provides a sense of sophistication, making data analysis feel more immersive and interactive.
3. Improves Battery Efficiency on OLED Displays
If you frequently access Power BI dashboards on mobile devices or laptops, switching to dark mode can have an added benefit—better battery efficiency. Devices with OLED or AMOLED screens use less power when displaying dark colors, extending battery life and making mobile data analysis more practical.
For professionals who rely on tablets or mobile Power BI applications, a dark-themed interface can help conserve battery life while maintaining a clean and responsive user experience.
4. Supports Better Focus and Reduced Distractions
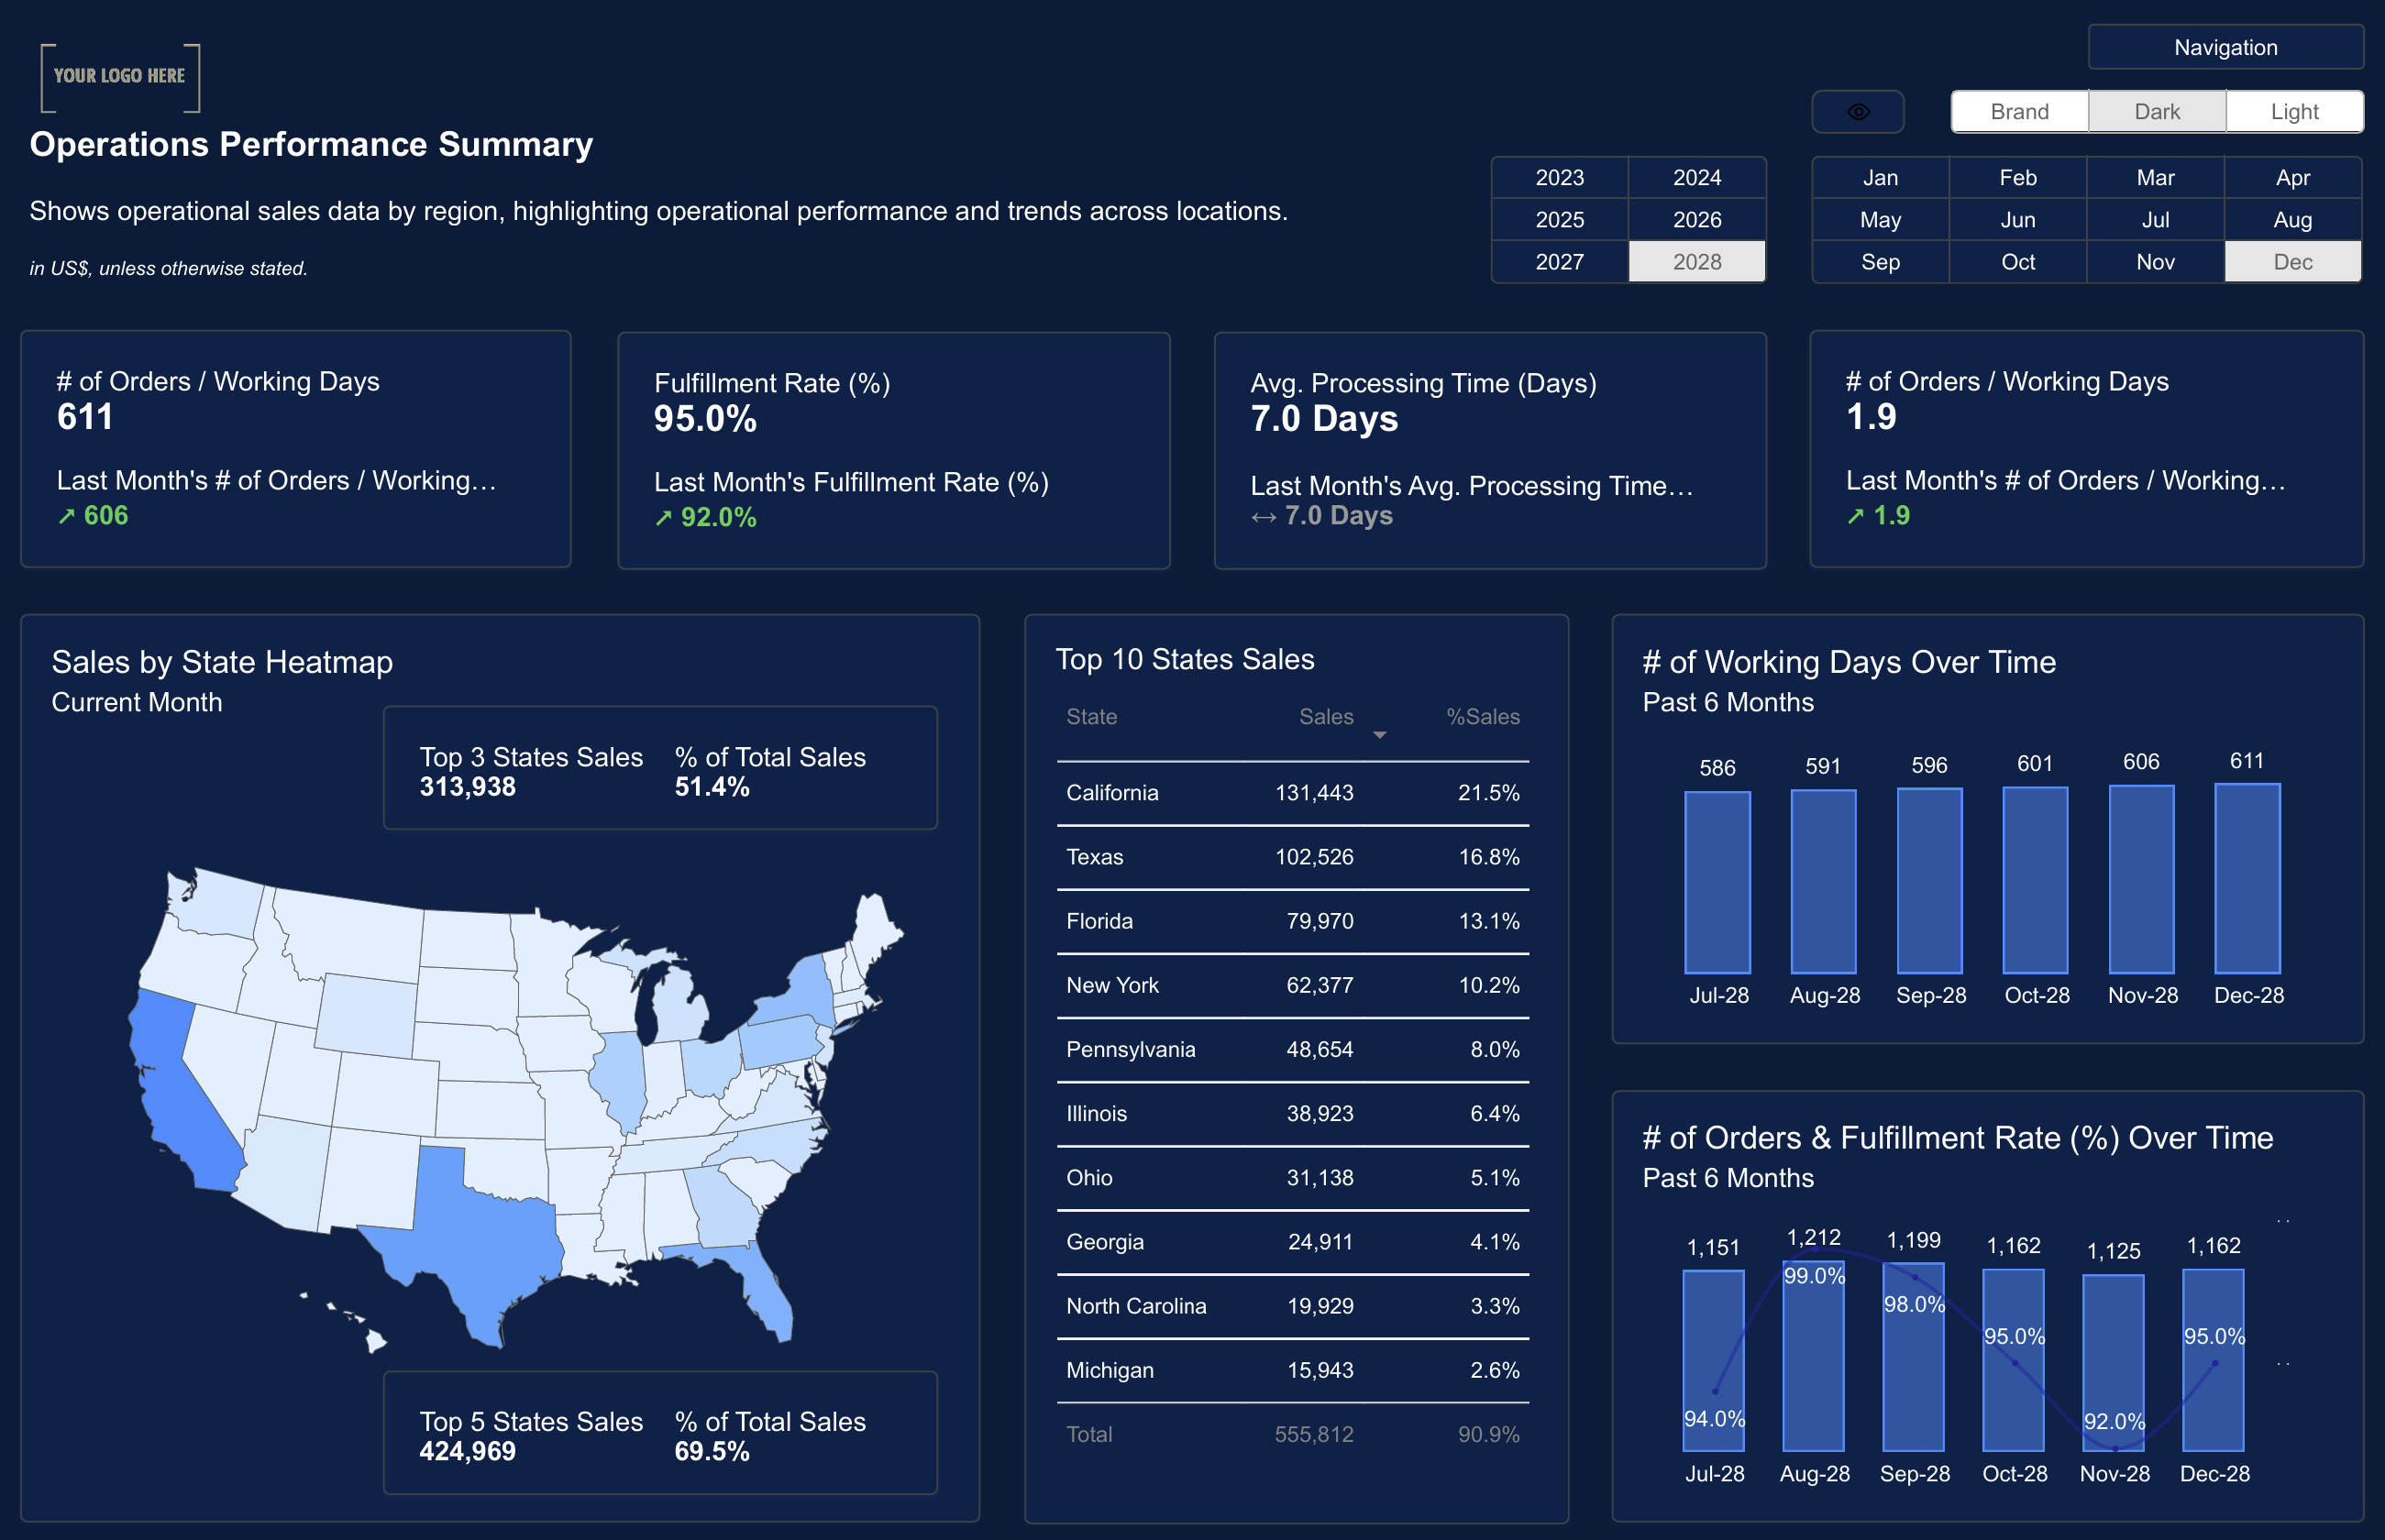
When working with complex datasets, maintaining focus is crucial. Dark mode minimizes distractions by reducing unnecessary brightness, allowing users to concentrate on the most relevant information. A well-structured dark-themed dashboard eliminates excess visual noise, making it easier to process insights without eye fatigue.
For teams collaborating on Power BI projects, a standardized dark mode theme can also ensure consistency in design and usability across multiple reports, improving the overall user experience.
5. Helps Users with Light Sensitivity
Some users experience discomfort or migraines when working with bright screens. Dark mode can help individuals with light sensitivity, making Power BI dashboards more accessible.
For professionals who work in low-light environments, switching to a dark background reduces harsh brightness, creating a more comfortable workspace.
By incorporating dark mode options, Power BI users can customize their dashboards to fit their individual needs, leading to a better overall experience.
How to Enable Dark Mode in Power BI?
Although Power BI does not currently offer an official dark mode, you can still create a similar dark-themed experience by applying custom themes and settings. This allows you to reduce eye strain, enhance data readability, and give your dashboards a modern and professional look. Below are several effective methods to enable dark mode in Power BI:
1. Use Power BI Themes
Power BI provides an option to customize the appearance of your dashboards using custom themes. By adjusting theme colors, you can apply a dark background with light-colored text and visuals to mimic dark mode.
How to Apply a Custom Dark Theme in Power BI:
- Open Power BI Desktop and navigate to your report.
- Click on "View" in the ribbon.
- Under the Themes section, click "Customize current theme".
- Change the background color to a dark shade (e.g., deep gray or black).
- Adjust visual colors to ensure that text, charts, and labels remain clearly visible.
- Save and apply the custom theme.
By modifying the theme settings, you can ensure a consistent dark mode experience across your Power BI dashboards.
2. Modify Report Backgrounds
Even if you're not using a full custom theme, modifying the report background can create a dark mode effect. The report background is what sits behind charts, tables, and visual elements, and adjusting it can significantly impact how your data appears.
Steps to Change Report Background Color:
- Open your Power BI report.
- Click on "Format" in the visualization pane.
- Select "Page Background" settings.
- Choose a dark color (e.g., black, dark gray, or navy blue).
- Adjust the transparency setting to 0% to keep the dark background solid.
This small change can reduce glare and make data elements stand out more clearly.

3. Adjust Visual Styles for Dark Mode
Changing chart and graph colors is crucial when implementing dark mode. Without the right contrast, certain colors may become difficult to read on a dark background.
How to Optimize Visual Styles for Dark Mode:
- Select a chart or visual in Power BI.
- Click on "Format" in the visualization settings.
- Adjust the data colors to brighter shades like white, yellow, cyan, or bright red to ensure good contrast.
- Modify the text and label colors to light gray or white for readability.
- Ensure that tooltips, legends, and gridlines are clearly visible against the dark theme.
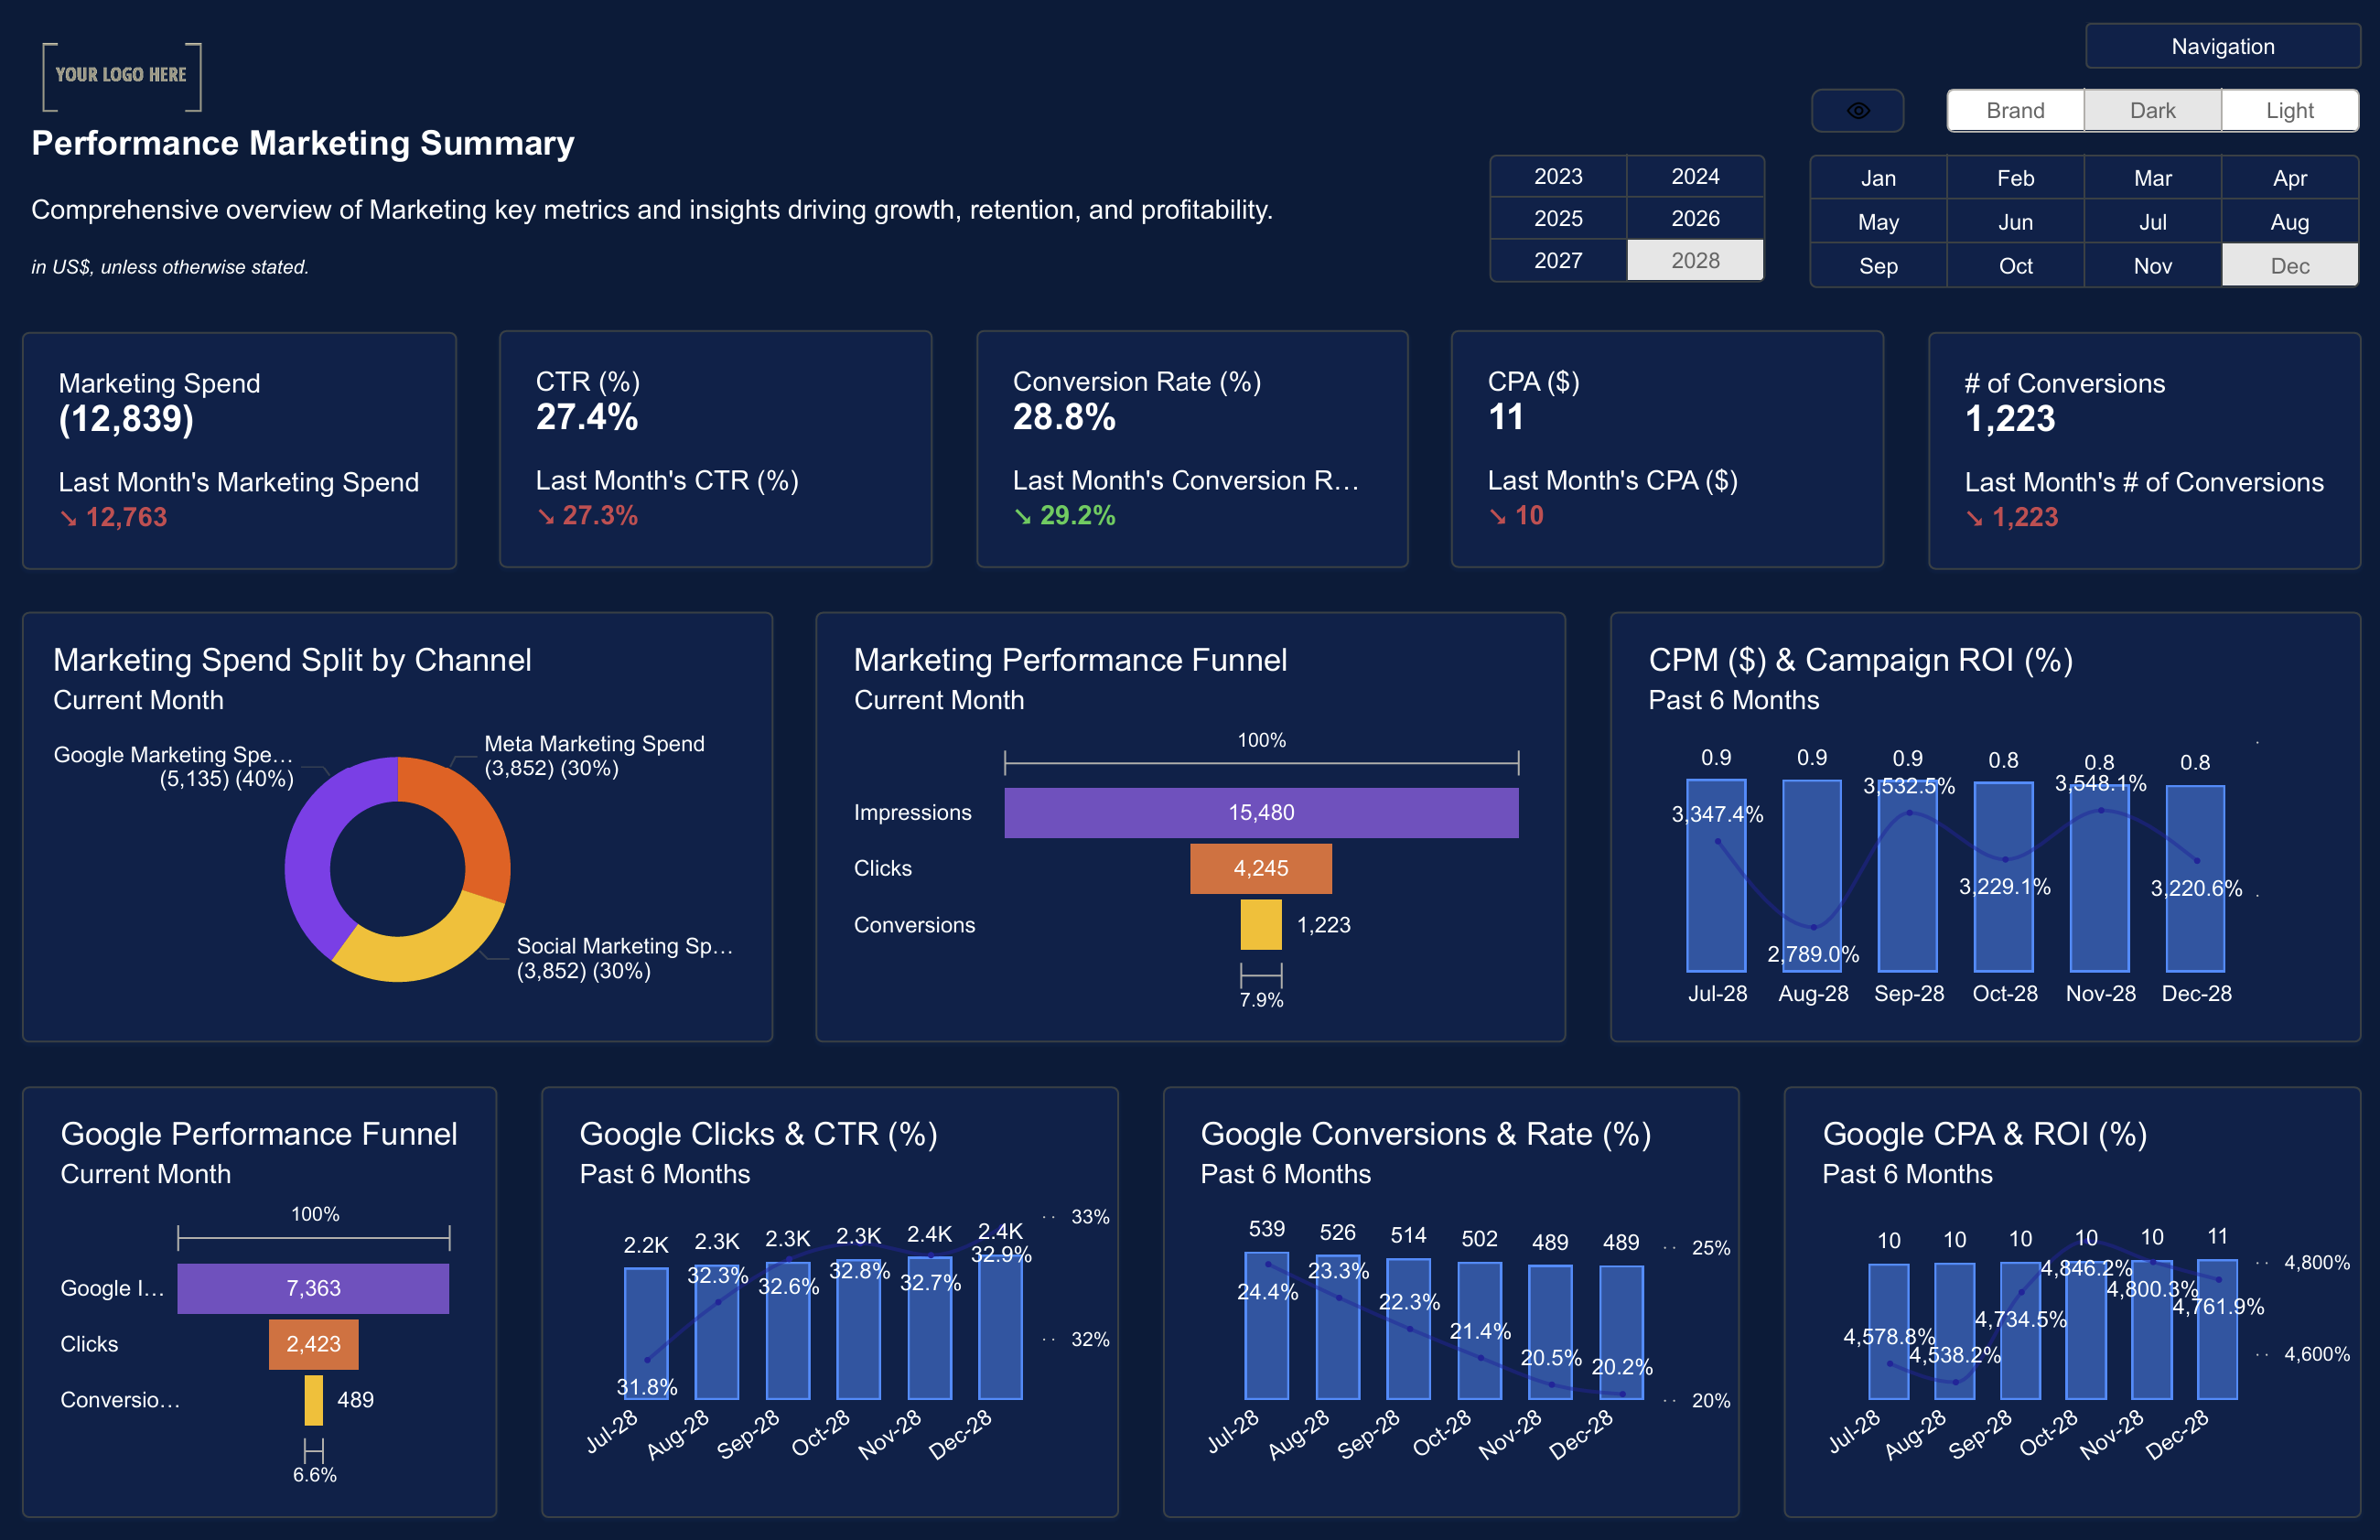
By customizing visual elements, you can enhance data readability while maintaining a modern and sleek dark mode design.
4. Use Third-Party Extensions and Browser Add-ons
For those who prefer an easier and faster approach, browser extensions and third-party tools can apply a dark mode filter across Power BI dashboards.
Popular Third-Party Solutions:
- Dark Reader (for Chrome, Firefox, Edge) – This browser extension applies a dark mode filter to web-based Power BI dashboards.
- Power BI Dark Theme Extensions – Several community-created Power BI plugins provide pre-made dark mode themes.
- Windows Dark Mode Settings – If you enable system-wide dark mode in Windows, it may influence certain Power BI UI elements.
Final Thoughts
Whether you’re a data analyst, business professional, or Power BI developer, dark mode in Power BI can significantly enhance your workflow. From reducing eye strain to improving data readability and creating visually appealing dashboards, it’s a small but impactful change that can transform how you interact with data.
If you’re looking for expert insights or need help optimizing your Power BI experience, PowerBIKit offers valuable resources to enhance your data visualization strategies. Explore how dark mode and other customization techniques can help you build better dashboards and work smarter with Power BI.
Download our Power BI templates now to enable Dark Mode and create stunning, customized dashboards with actionable insights effortlessly!
Subscribe to our newsletter
Lorem ipsum dolor sit amet, consectetur adipiscing elit. Suspendisse varius enim in eros elementum tristique.
Related posts
Lorem ipsum dolor sit amet, consectetur adipiscing elit.
How to Apply Multiple Conditions Using Filters in Power BI Effectively
Why You Need a Design System for Power BI Dashboards