
Conclusion
Applying Power BI filter multiple conditions is an essential skill for extracting precise insights from complex datasets. Whether using basic filters, advanced filters, or interactive slicers, understanding how to apply and manage multiple conditions effectively ensures that reports remain accurate and actionable. Additionally, leveraging the filter pane helps maintain consistency and control over data views, enhancing the overall analytical experience. By following best practices and addressing common challenges, users can create powerful, data-driven reports that support informed decision-making. For advanced solutions and expert guidance on maximizing the potential of Power BI, explore the resources available at CraftedBI, where innovation meets data excellence.
Understanding Filters in Power BI
Filters in Power BI provide a way to control what data is displayed in reports and dashboards. They allow users to include or exclude specific data points based on predefined criteria. Power BI offers various types of filters that can be applied at different levels:
- Visual Filters: These filters are applied to a single visual, affecting only the data displayed in that specific chart, graph, or table.
- Page Filters: Page filters apply to all visuals on a particular report page, ensuring consistency across the displayed information.
- Report Filters: Report filters are applied at the report level, impacting all pages and visuals within the report, providing a global filter across the entire dataset.
Each of these filters plays a unique role in shaping how data is presented, allowing users to customize their reports to meet specific analytical requirements.
Why Apply Power BI Filter Multiple Conditions?
In many business scenarios, analyzing data requires more than just a single condition. Multiple conditions help refine the data further by considering different variables simultaneously. This approach is especially useful in scenarios where data needs to be analyzed across multiple dimensions or where multiple factors influence business outcomes.
For instance, a sales report may require filtering data to show only transactions that occurred in specific regions while also focusing on orders that exceed a certain value. By applying multiple conditions, users can compare performance across different segments, identify key trends, and gain a deeper understanding of business operations.
Methods for Applying Power BI Filter Multiple Conditions
To apply multiple conditions effectively in Power BI, it is important to understand the different approaches available. Depending on the complexity of the filtering requirements, users can choose from various methods to refine their data.
Using Basic Filters with Multiple Values
Basic filters allow users to select multiple values from a list, making it easy to include or exclude certain categories. This method is ideal for scenarios where the user wants to compare multiple categories or regions without applying complex conditions.
For example, a marketing report might need to display data for different geographic regions, such as North America and Europe, while excluding data from other regions. By selecting multiple values in the filter, the report can focus only on the relevant regions.
Applying Advanced Filters for Complex Criteria
Advanced filters provide greater flexibility by allowing users to define conditions using logical operators such as “AND” and “OR.” These filters are useful when multiple criteria need to be considered simultaneously to refine data accurately.
In a sales analysis report, for instance, an advanced filter can be used to show data where the sales amount exceeds a certain threshold and the order status is marked as “Completed.” Alternatively, an “OR” condition can be applied to include records where the customer is either a new or returning client.
Leveraging Slicers for Dynamic Filtering
Slicers are interactive elements in Power BI that give users control over the data displayed in their reports. By using slicers, users can dynamically filter data based on multiple conditions, allowing for more customized and user-driven analysis.
For example, a financial report can include a slicer that enables users to filter by different time periods and product categories simultaneously. This approach empowers end-users to explore data from multiple perspectives without modifying the underlying filters.
Using Filter Pane to Apply Multiple Conditions
The filter pane in Power BI provides a centralized space where users can manage and apply multiple filters effortlessly. It offers a user-friendly interface where different conditions can be combined using “AND” and “OR” logic to fine-tune the data displayed in reports. Users can easily add, modify, and delete filters, ensuring that only relevant information is highlighted.
Additionally, the filter pane allows users to lock filters that should remain consistent across different pages of a report. This feature is particularly useful when creating multi-page reports that require consistent filtering criteria. By using the filter pane effectively, users can maintain control over data visualization and ensure that reports remain aligned with business objectives.
Best Practices for Applying Multiple Conditions
Applying multiple conditions effectively requires a thoughtful approach to ensure accurate and meaningful results. To optimize the use of multiple conditions in Power BI filters, consider the following best practices:
- Define Clear Objectives: Determine the exact conditions that need to be applied to the data to meet analytical goals. Having a clear understanding of the business questions helps in applying the right filters.
- Use Logical Operators Appropriately: Use “AND” when all conditions need to be satisfied and “OR” when any condition can be met. Misusing these operators can lead to incorrect data representation.
- Limit Filter Overload: Applying too many filters can slow down report performance and make it difficult to interpret results. Focus on essential filters that provide valuable insights.
Test and Validate Conditions: Before publishing a report, test different filter combinations to ensure that the applied conditions generate the expected results. Validating the output helps in avoiding potential errors.

Common Challenges When Applying Multiple Conditions
Despite the flexibility offered by filters in Power BI, applying multiple conditions can sometimes lead to unexpected outcomes. Being aware of common challenges helps users troubleshoot issues effectively.
- Data Inconsistencies: Conflicting conditions can lead to empty results or missing data. It is essential to check the compatibility of conditions to ensure that they do not cancel each other out.
- Slow Report Performance: Applying multiple conditions on large datasets may slow down report loading times. Optimizing data models and reducing unnecessary filters can improve performance.
Incorrect Logic Application: Misuse of logical operators can produce incorrect results. Ensuring that the correct combination of “AND” and “OR” is applied helps maintain the integrity of the filtered data.
Conclusion
Applying Power BI filter multiple conditions is an essential skill for extracting precise insights from complex datasets. Whether using basic filters, advanced filters, or interactive slicers, understanding how to apply and manage multiple conditions effectively ensures that reports remain accurate and actionable. Additionally, leveraging the filter pane helps maintain consistency and control over data views, enhancing the overall analytical experience. By following best practices and addressing common challenges, users can create powerful, data-driven reports that support informed decision-making. For advanced solutions and expert guidance on maximizing the potential of Power BI, explore the resources available at CraftedBI, where innovation meets data excellence.
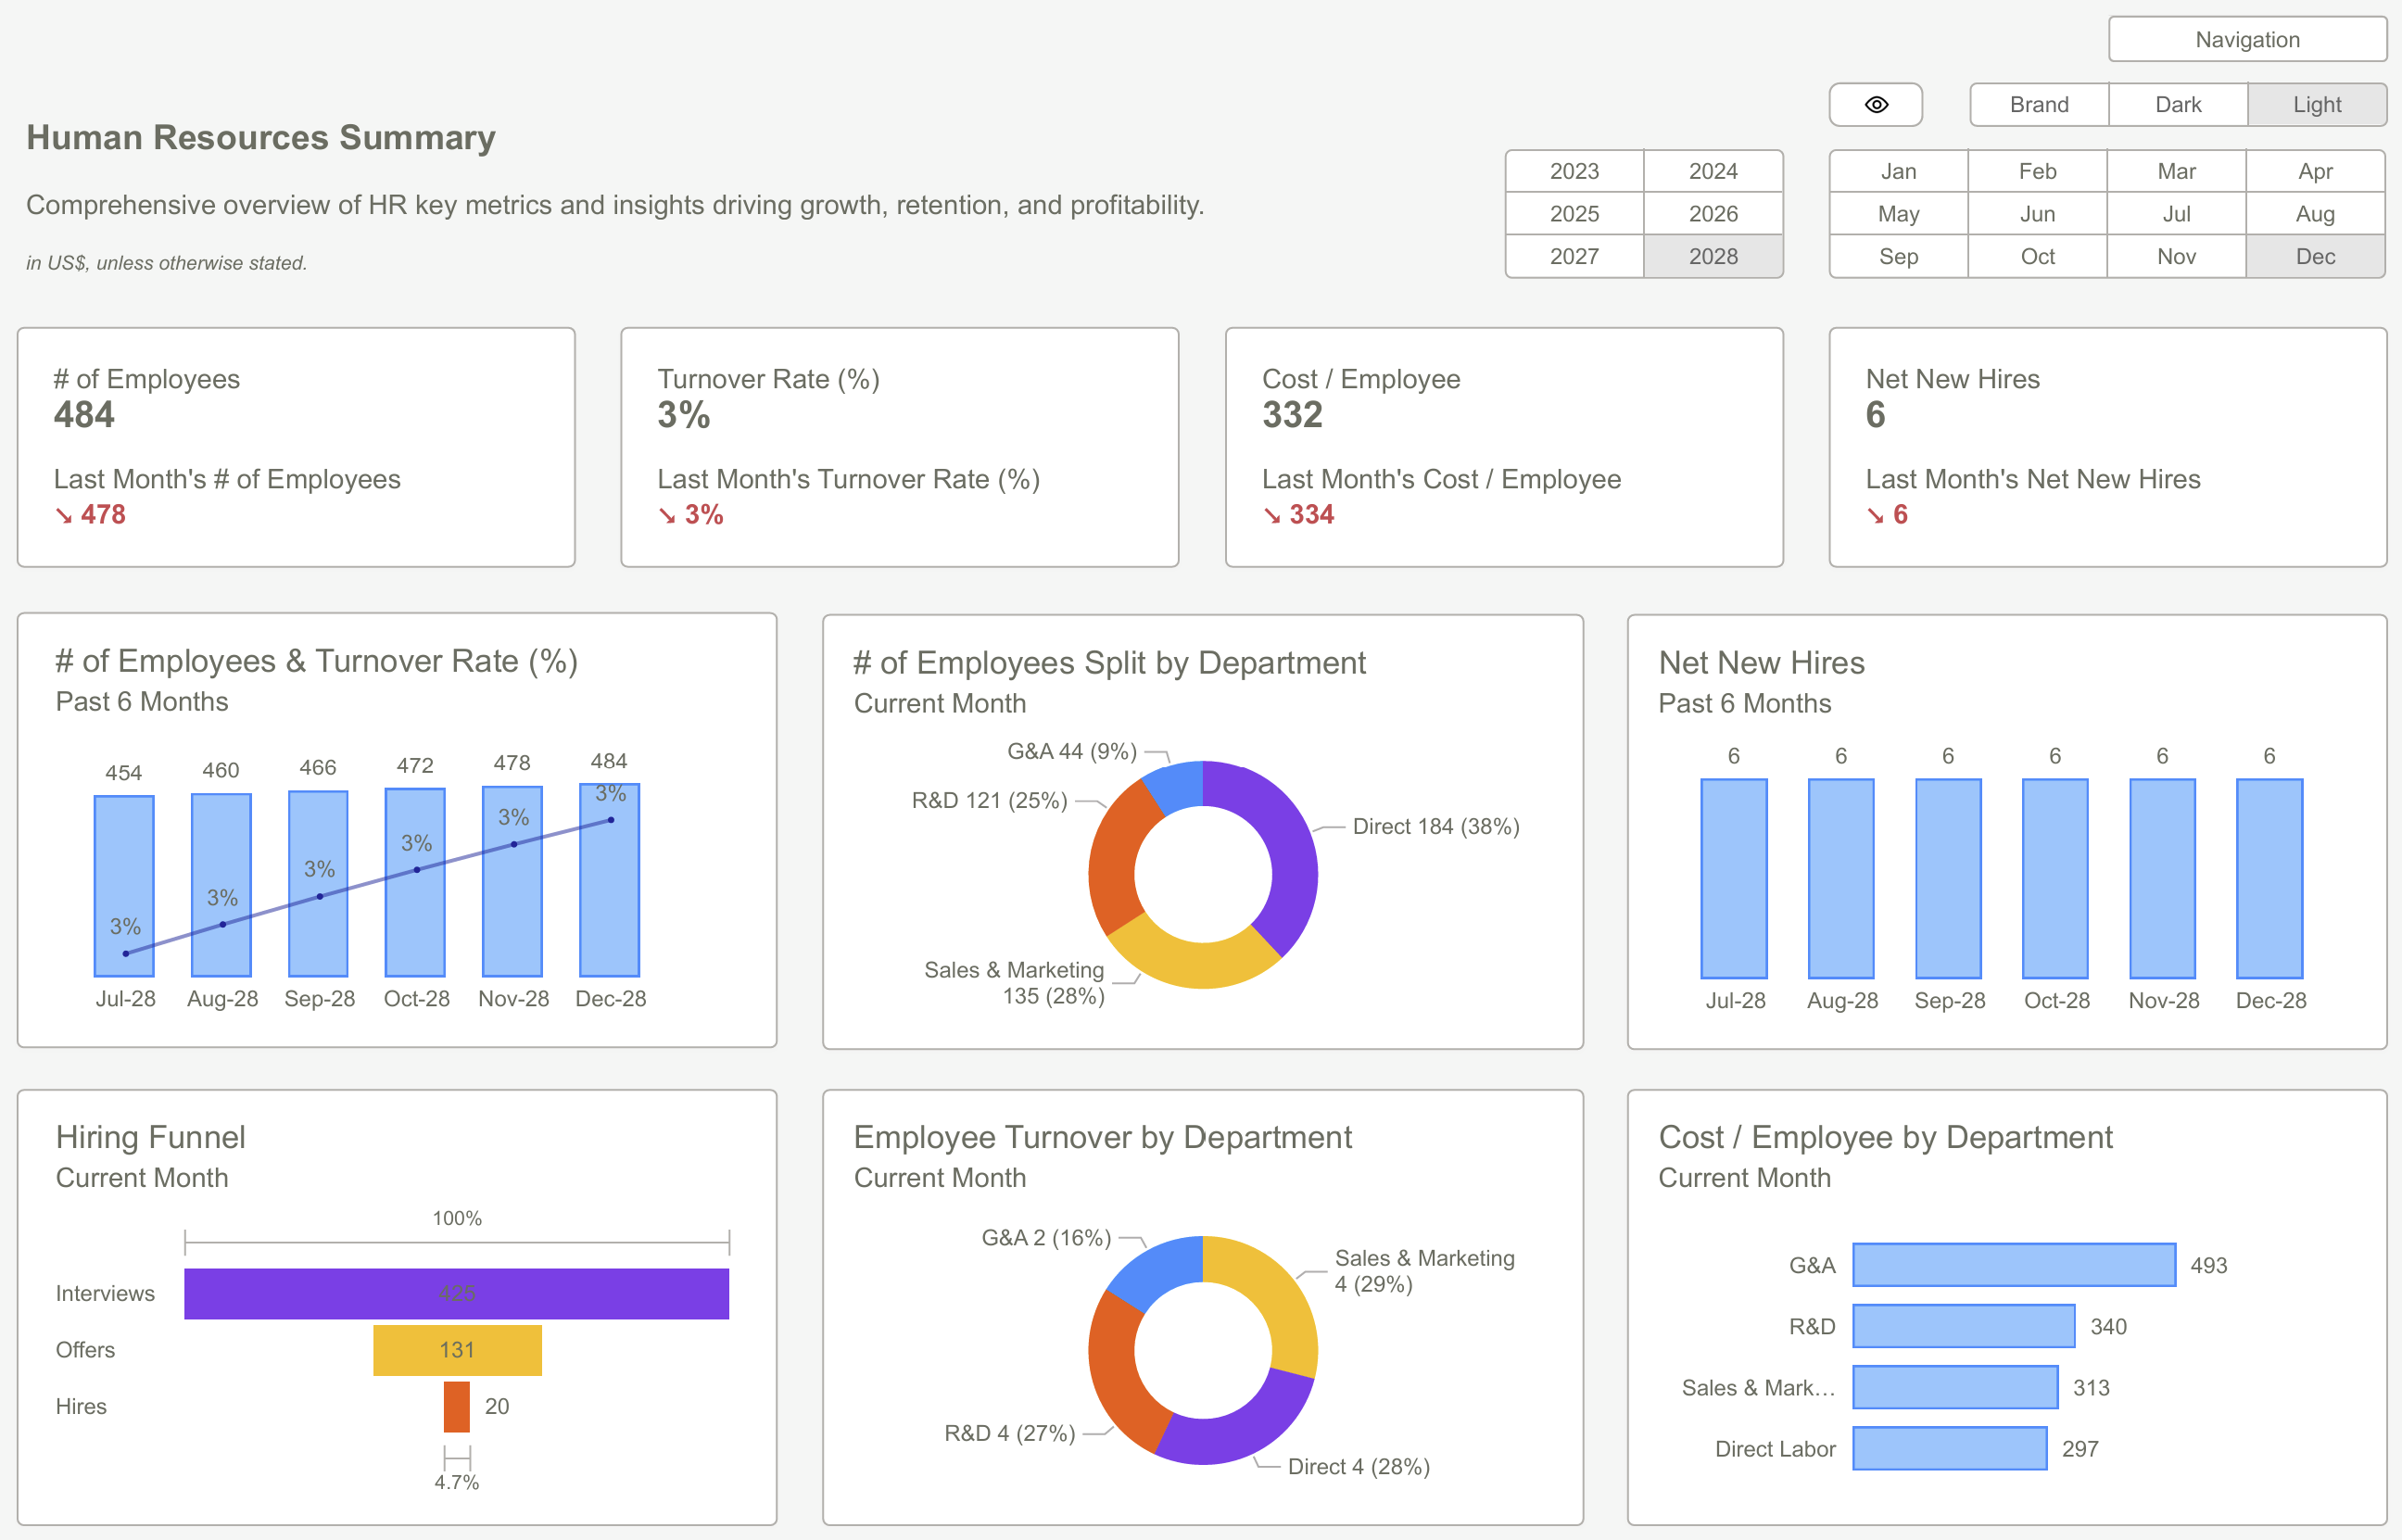
Download our Power BI Templates now and enhance your HR reporting with actionable insights using filters in Power BI for precise data analysis.
Subscribe to our newsletter
Lorem ipsum dolor sit amet, consectetur adipiscing elit. Suspendisse varius enim in eros elementum tristique.
Related posts
Lorem ipsum dolor sit amet, consectetur adipiscing elit.
What Are the Top Benefits of Using Dark Mode in Power BI Dashboards?
Why You Need a Design System for Power BI Dashboards